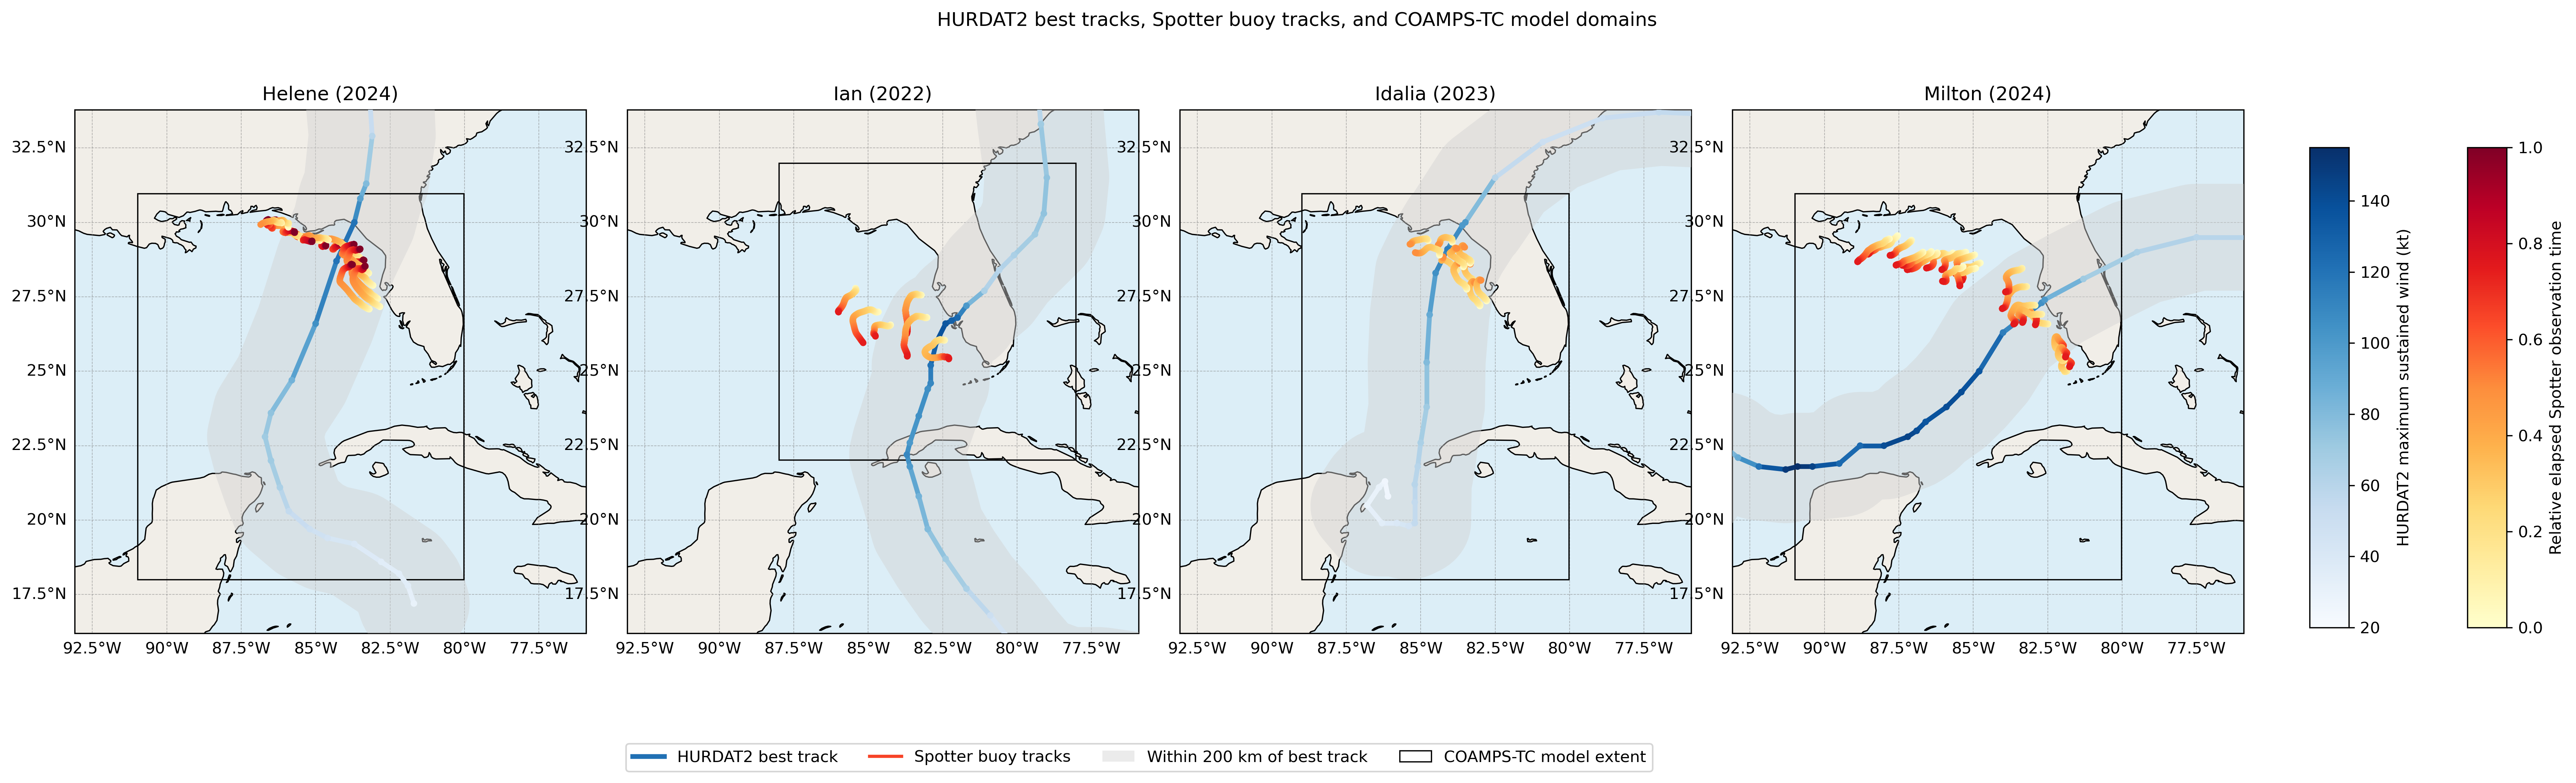
 Hurricane tracks, Spotter buoy trajectories, and model domain coverage for the four tropical cyclones analyzed in this study: Helene (2024), Ian (2022), Idalia (2023), and Milton (2024). The blue line shows the National Hurricane Center best-track position, colored by storm maximum sustained wind speed (kt) from the HURDAT2 archive. The light-gray shaded region denotes the area within 200 km of the best-track center, and the black rectangle indicates the horizontal extent of the COAMPS-TC model domain used for storm-relative analyses. Spotter buoy trajectories are overlaid and colored by normalized observation time, where each buoy deployment is scaled from 0 (deployment start) to 1 (deployment end). This normalization preserves equal temporal spacing between successive observations within each trajectory, allowing direct comparison of buoy evolution and sampling patterns across storms despite differences in deployment duration. Together, these tracks illustrate the spatial relationship between buoy observations, storm evolution, and model coverage throughout the analyzed tropical cyclone events.