Idalia specific analysis (data provided by Jake)
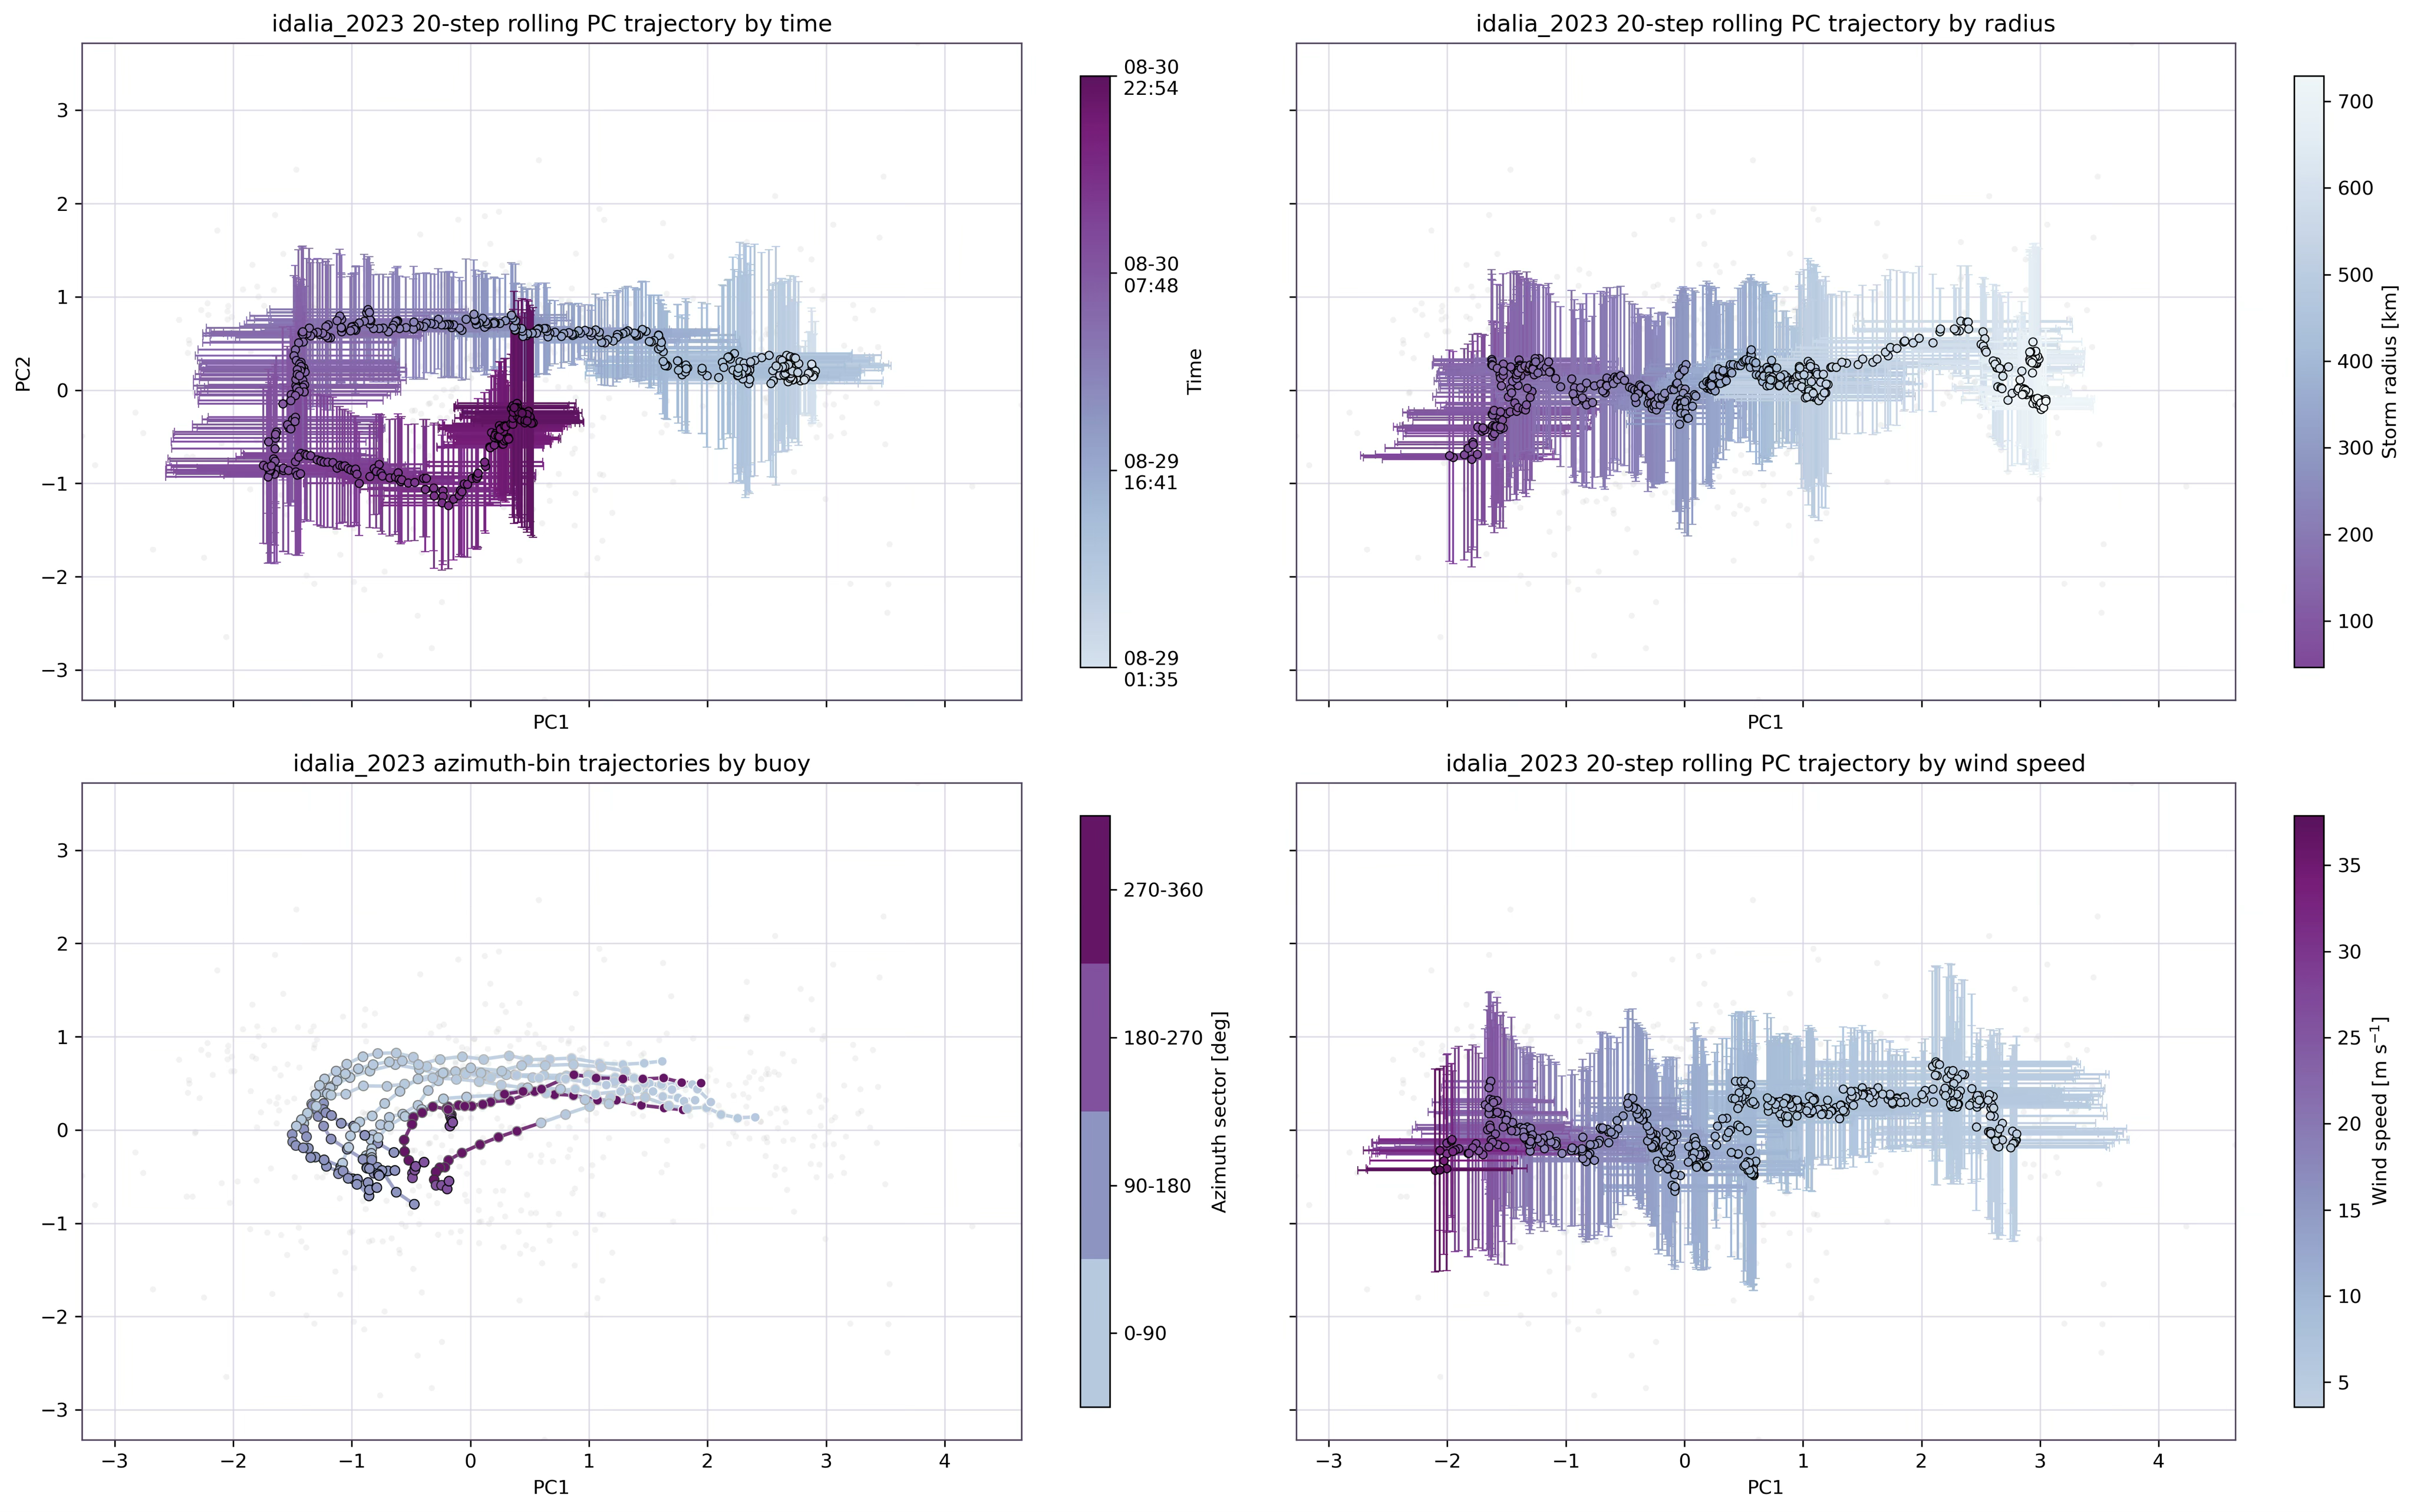 This figure shows data from Hurricane Idalia plotted in the global state space. Trajectories as a function of time (upper left), storm radius (upper right), windspeed (bottom right). Individual buoy trajectories as a function of time (bottom left) and colored by azimuth (front right: 0-90, back right: 90-180, etc.)