Used for showing connectivity through time and isomap space.
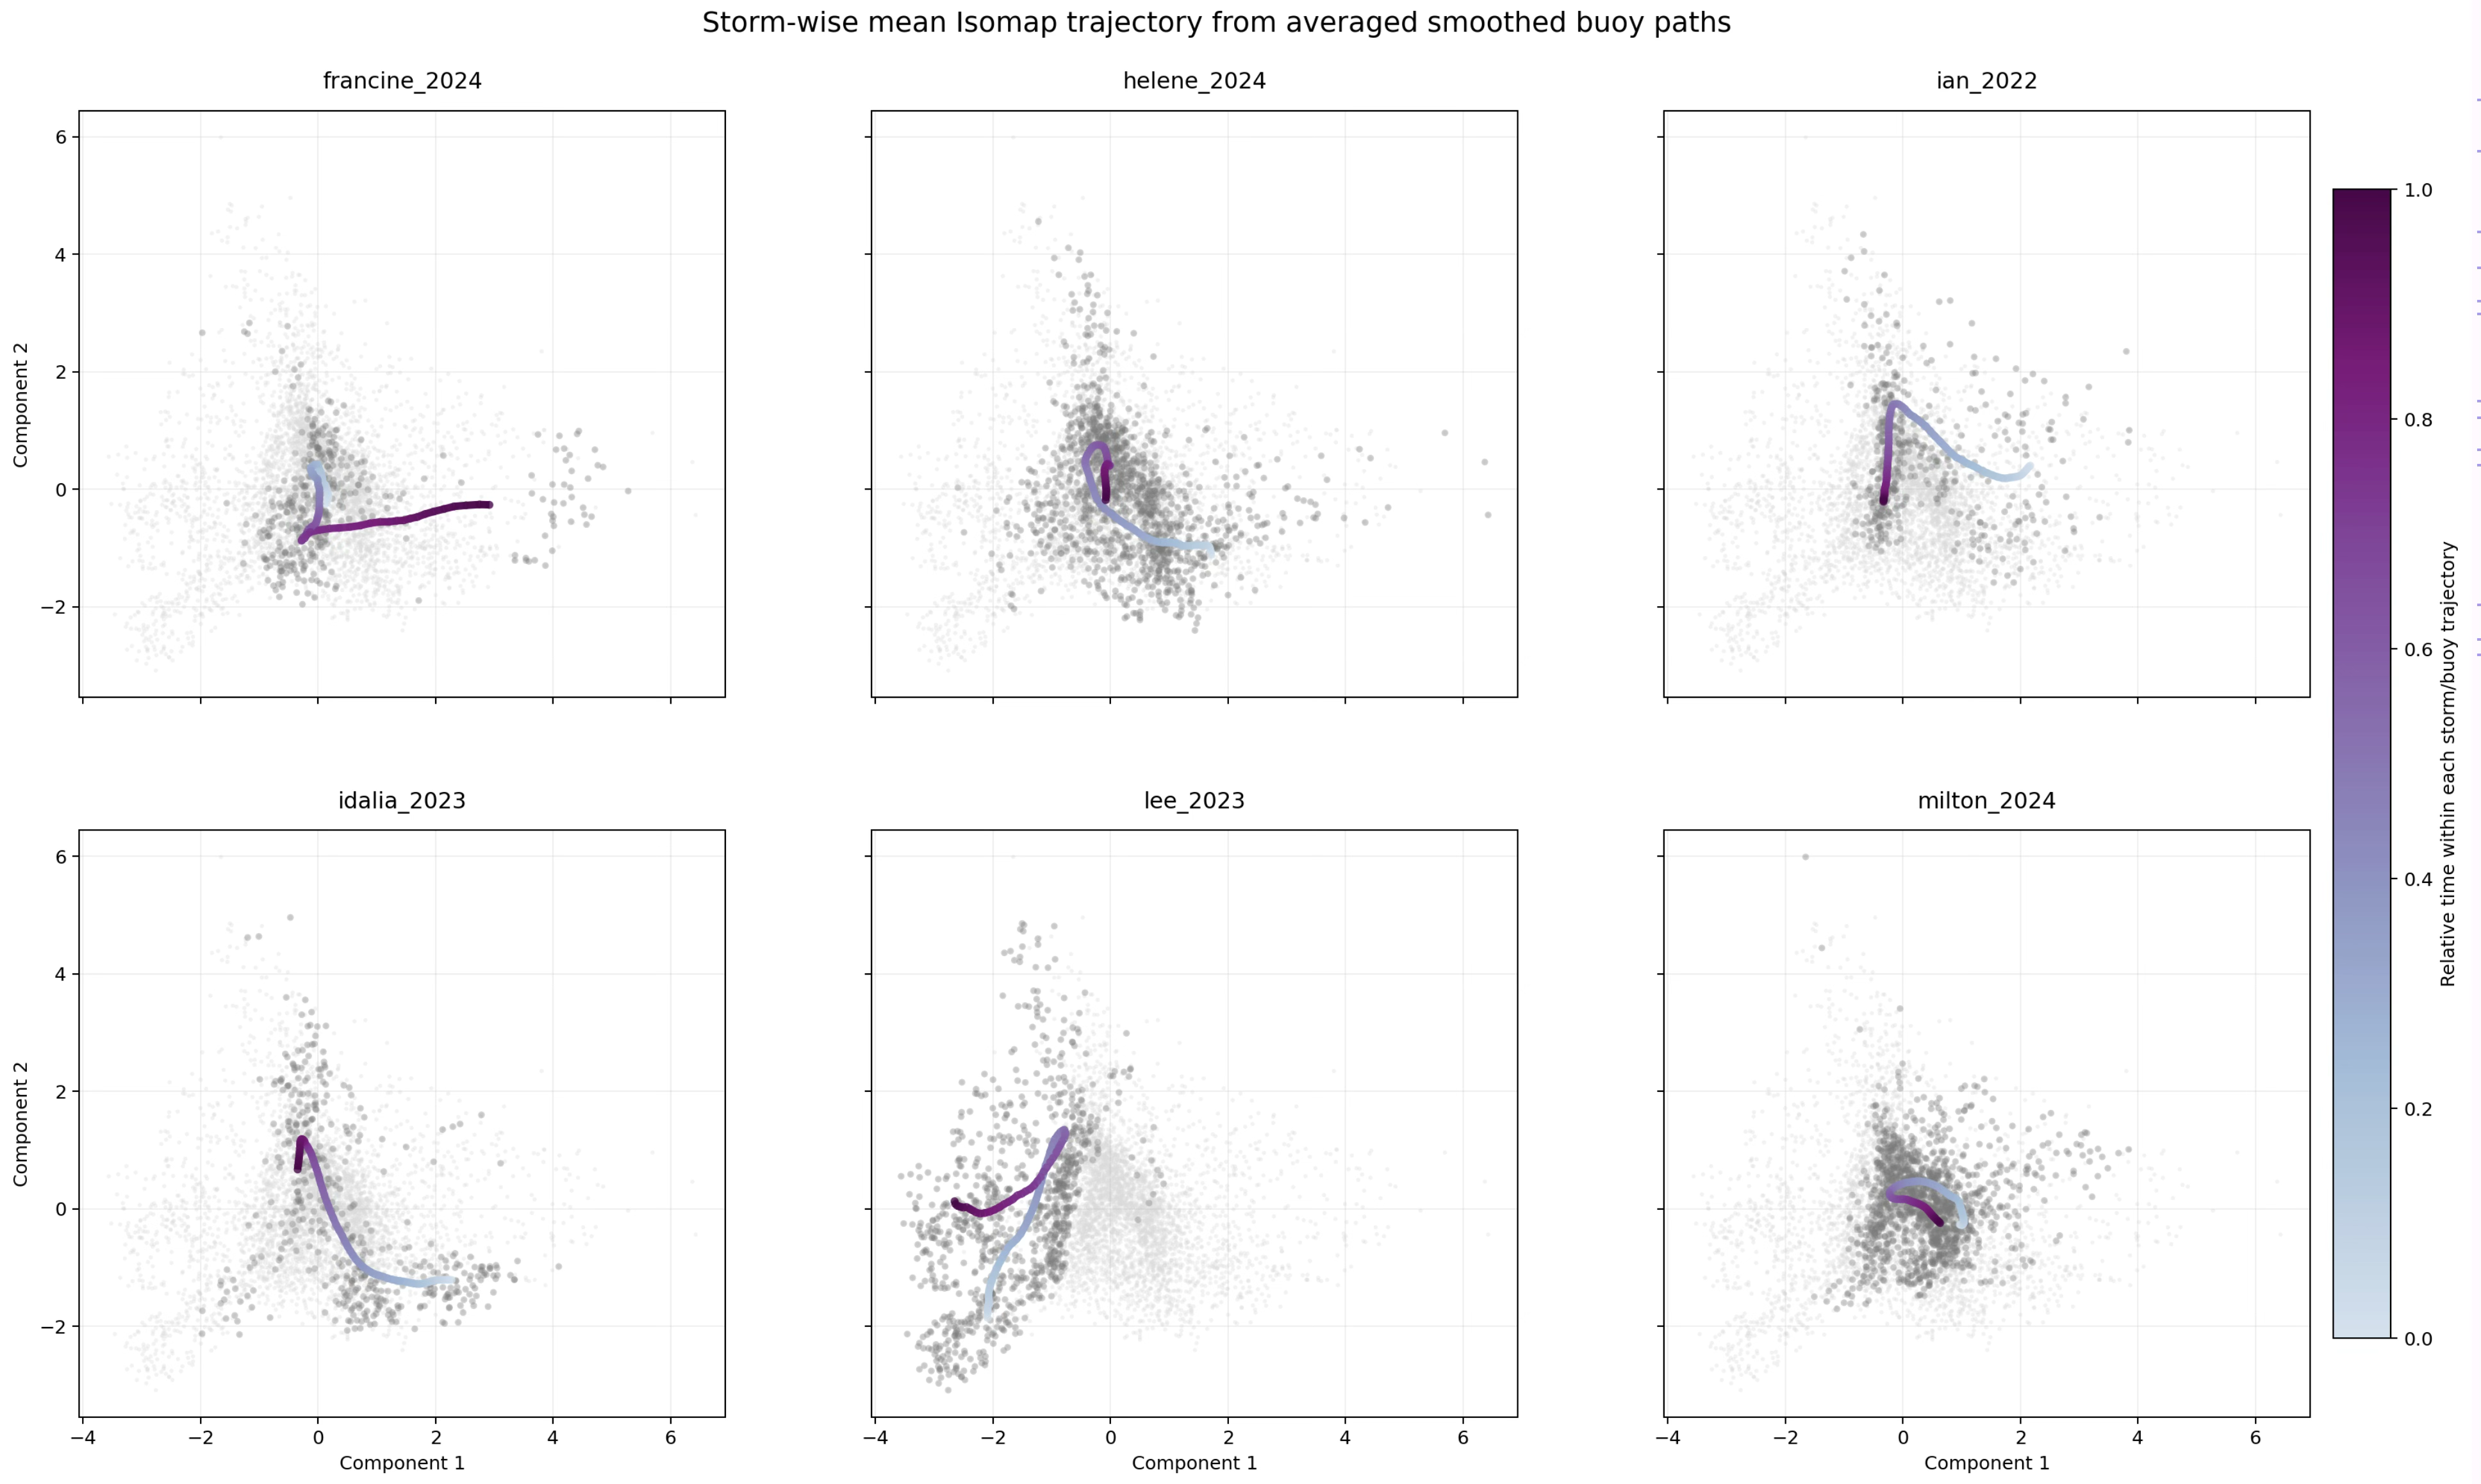 Storm-mean trajectories through the two-dimensional Isomap embedding of the four-dimensional wave–wind feature space. Gray points show all observations, while colored curves represent temporally smoothed storm-mean trajectories. Multiple storms evolve through a common high-density transition region before diverging into distinct manifold branches, indicating that TC wave fields occupy constrained and physically preferred regions of state space. The curved trajectories demonstrate that relationships between spectral scale, steepness, and directional organization are fundamentally nonlinear and not fully captured by linear variance-based methods.