Same plot as earlier but with density distributions colored by average physical value in that bin
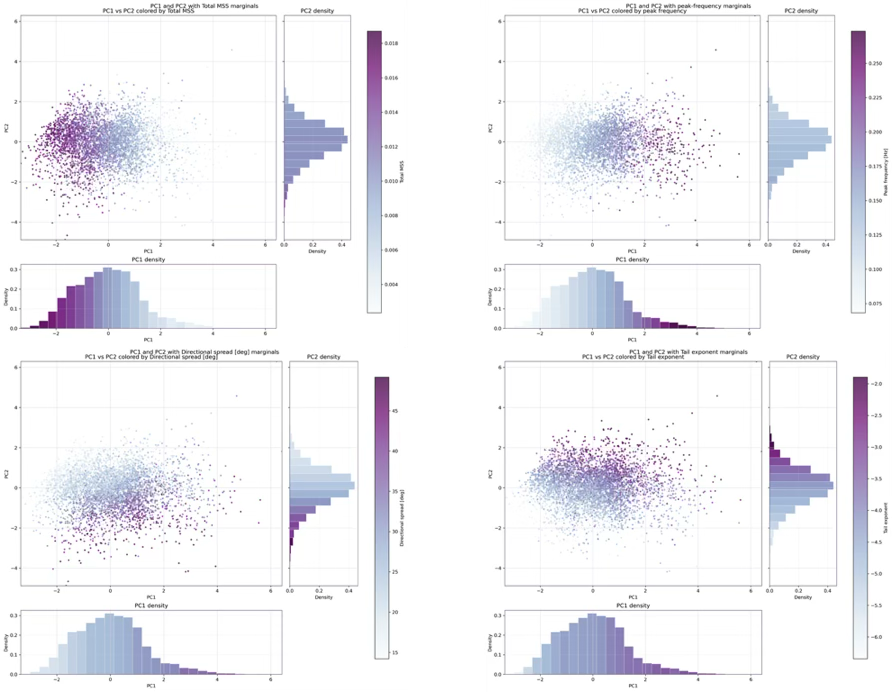 Same figures as figure 2 but with an additional PDF on each axis. The PDF is colored by the average value of each respective variable across axis bins, showing the dependence of primary variables on PC1 and PC2. MSS and peak frequency (upper row) do not vary substantially with respect to PC2 but vary primarily with PC1. Directional spread and tail exponent (bottom row) vary with both PC1 and PC2. Spec. tail slope varies positively with both PC1 and 2 while directional spread varies inversely across PC1 and 2.