Description of the primary PCs as they relate to the original features
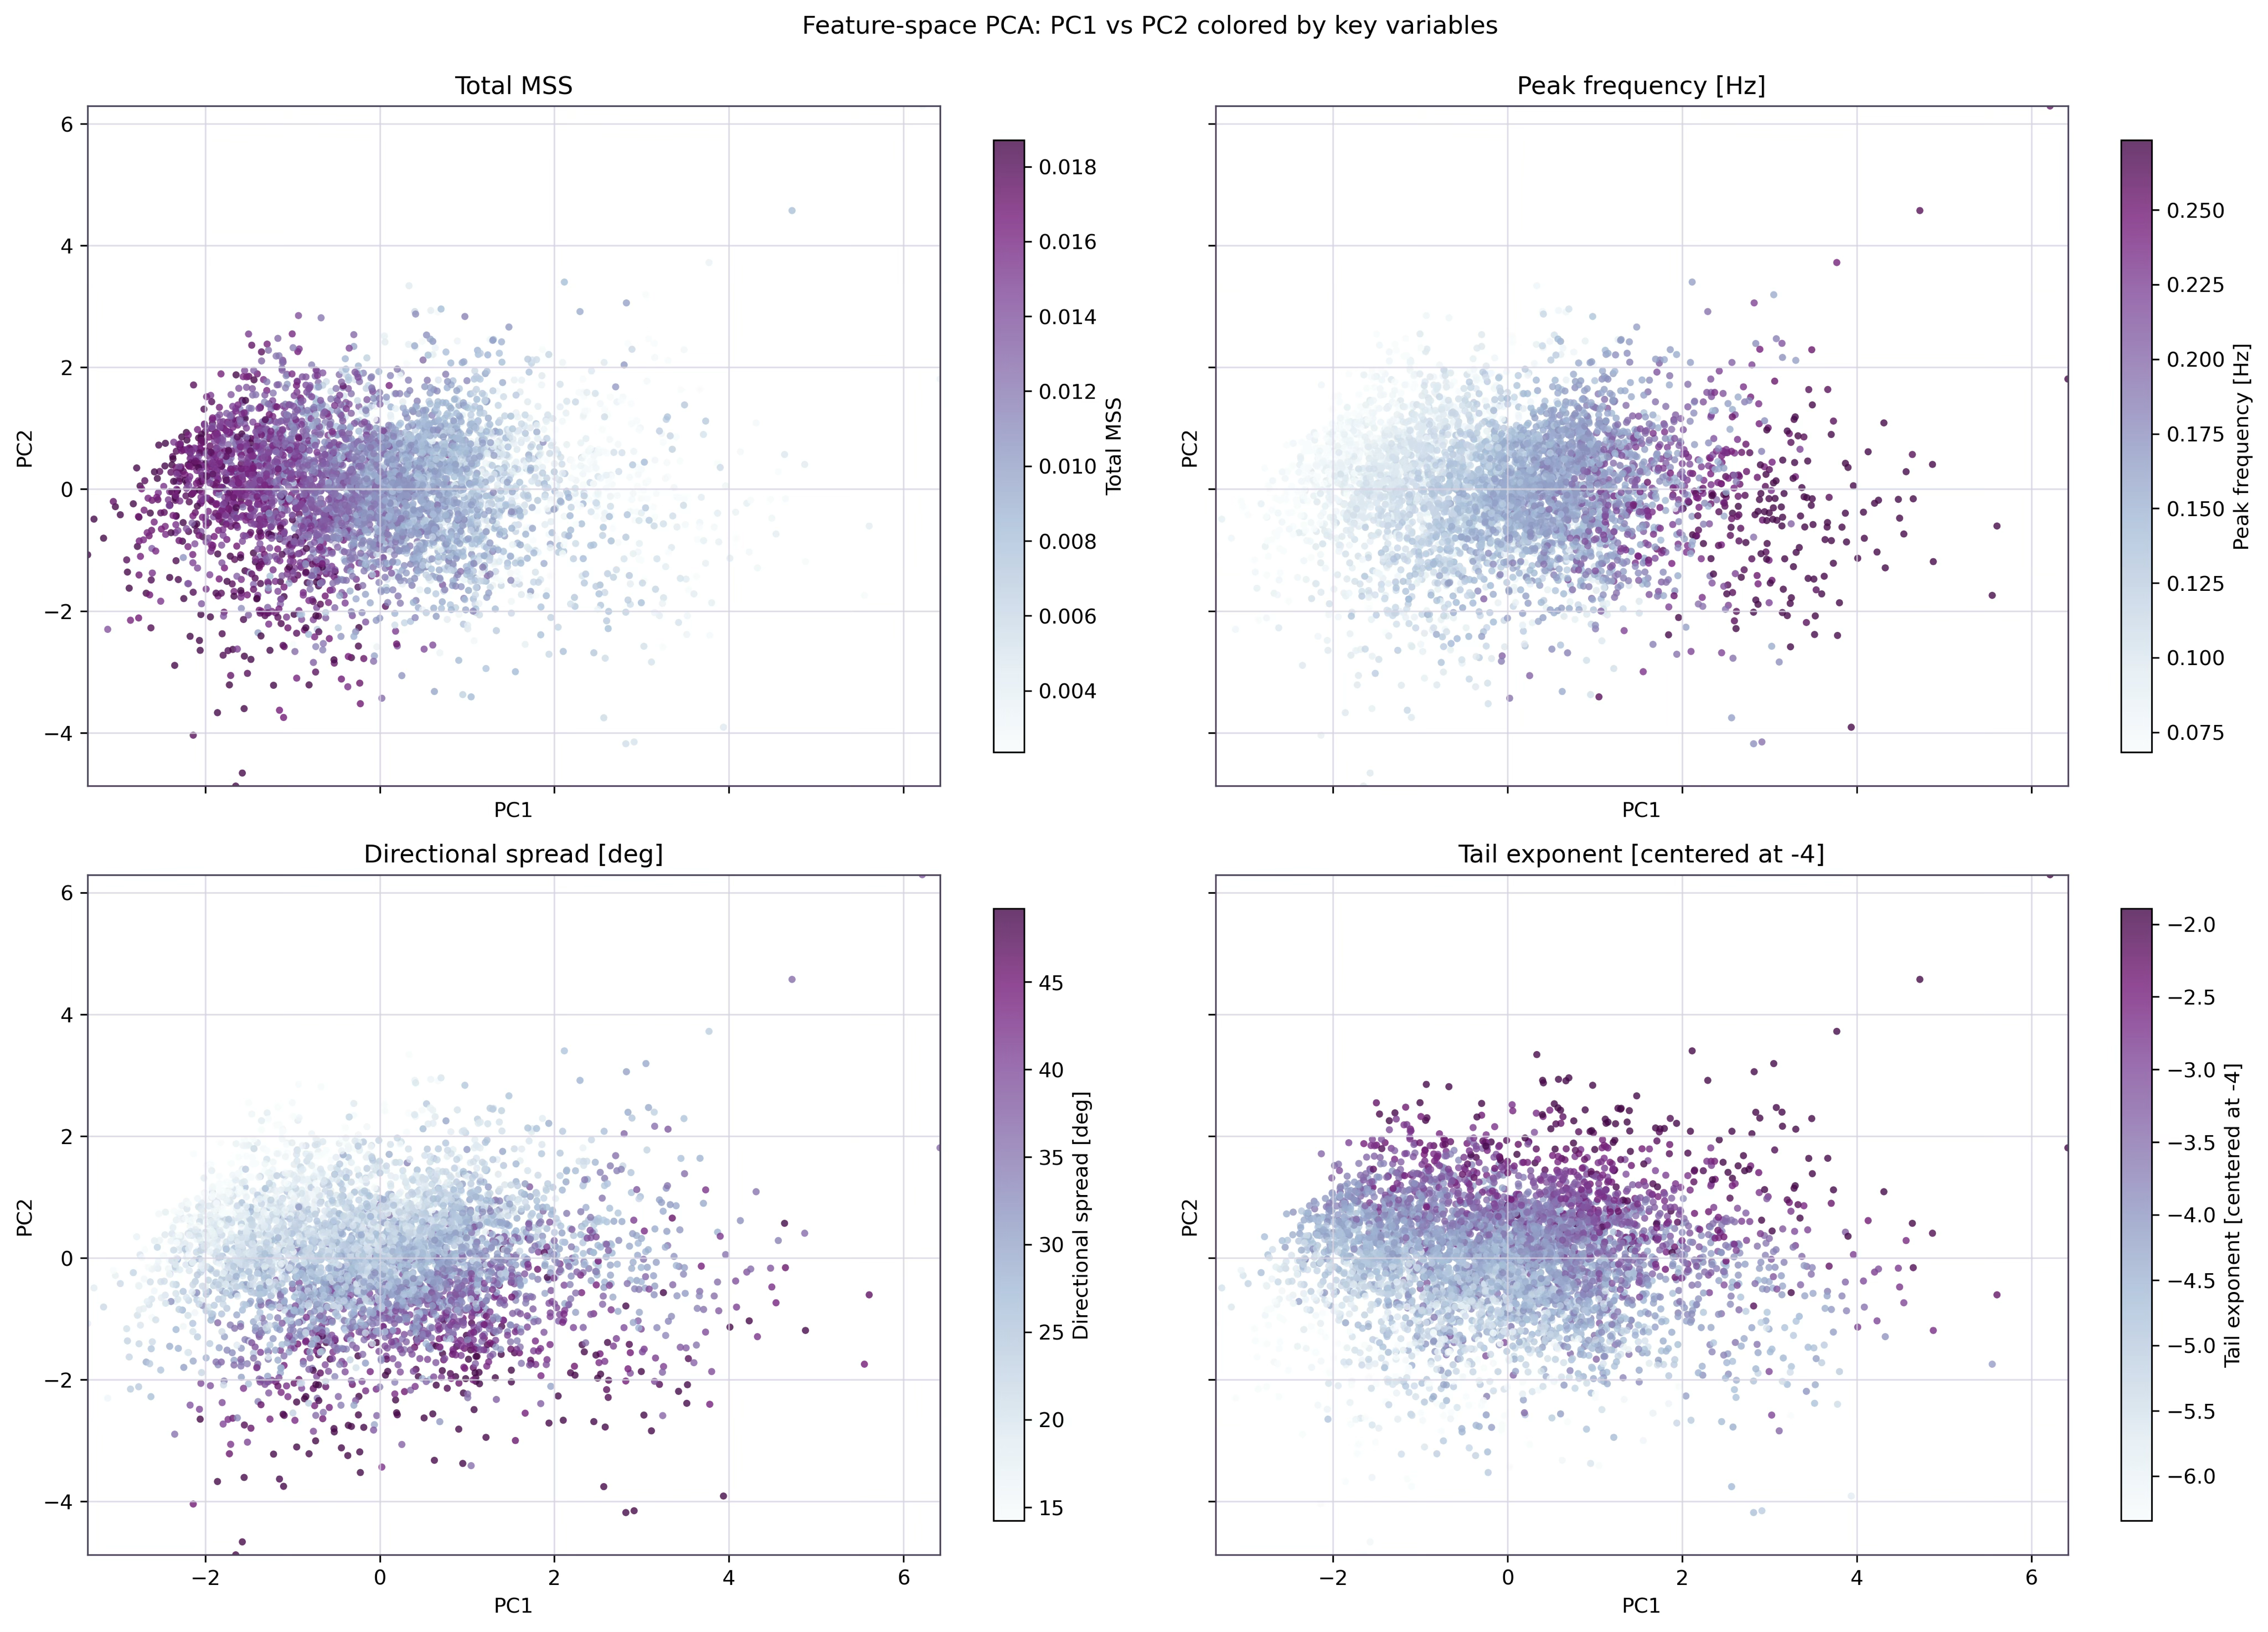 PC1 vs PC2 for all storms colored by total mss (upper left), peak frequency (upper right), directional spread (lower left), and high frequency spectral tail slope (bottom right). The primary axis is defined by an inverse relationship between total mss and peak frequency. The secondary axis is primarily described by a tradeoff between the spectral tail exponent and the directional spread.